When you set two keys on a property, the value in between those keys is automatically calculated. This is called interpolation. Interpolation settings can be customized to create dramatically different results.
You can set the easing on your keys by either using the Interpolation panel to the right of the Timeline, or by using the Graph Editor, which you can toggle on via the shortcut near the Timeline options.
Using the Interpolation Panel
The Interpolation Panel appears to the right of the timeline when you select any number of keys on the timeline.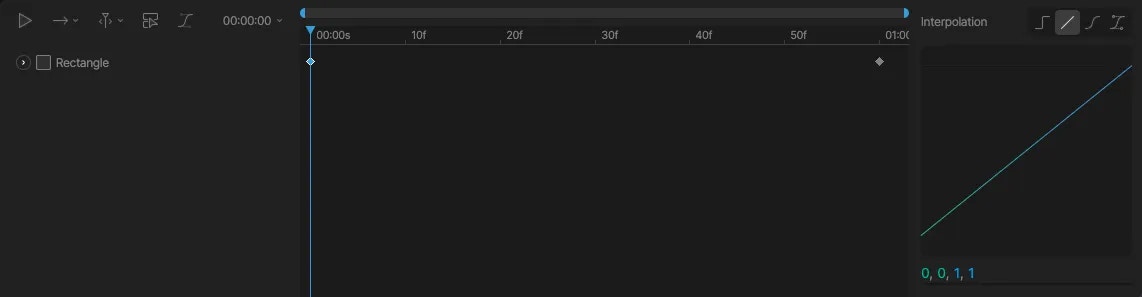
Linear
Cubic
Hold
Interpolation field
A text field below the preview graph represents the interpolation in a numerical format. A total of four values (typically between 0 and 1) represent the position of the handles – two for the inward curve, and two for the outward curve. You can see how these values change by dragging the handles within the preview window. Use this field if you wish to set specific easing values, perhaps defined in a design language for a specific brand, for instance. The field also makes it easy to copy and paste values across files and tools. When inputting values manually, use a comma or a space to separate each of the four values.The Graph editor
Rive’s Graph editor visually represents how an object’s properties change over time. Using this graph, we can edit the rate of change and the values being interpolated.